Brief Summary
This course is all about mastering advanced statistical functions in EXCEL 2010 and 2013. You’ll dive into different distributions and learn to analyze data effectively. Plus, there are loads of practical examples and quizzes to help you really get it!
Key Points
-
Learn to use advanced statistical functions in EXCEL 2010 and 2013
-
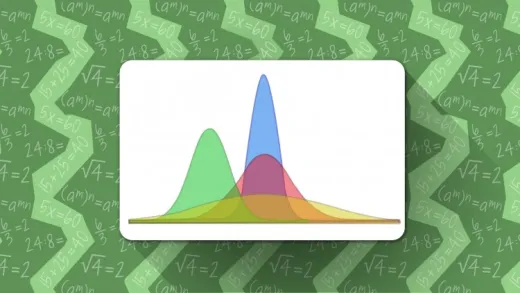
Understand different distributions like Normal, Student-t, Chi-square, and more
-
Calculate margin of errors and create confidence intervals
-
Create Standard Normal tables and Student t tables
-
The course includes practical illustrations and quizzes
Learning Outcomes
-
Be comfortable with advanced statistical functions in EXCEL 2010-2013
-
Solve inferential statistical problems effectively
-
Create various statistical tables and confidence intervals
-
Apply advanced statistical tools for educational and professional work
-
Finish a course in about a month with tons of practical knowledge
About This Course
Learn how to use advanced statistics functions in EXCEL 2010 and 2013 to effectively analyze data.
Updated material to include latest advanced Statistical functions in EXCEL 2013
This course has been updated to include the latest advanced statistical functions in EXCEL 2013. It provides you with a vast array of analytical tools to handle most
The course is about using the advanced statistical functions in EXCEL for data analysis and analytics projects.
You will learn how to effectively use Advanced Excel Statistical Functions about the Normal distribution, Student-t distribution, chi square distribution, F distribution, Gamma, Log-normal, Negative Binomial, Exponential, etc.
You will learn how to calculate the margin of errors and use them to create confidence intervals. In addition, you will learn how to create Standard Normal tables as well as Student t tables.
This course is very well illustrated with lots of practical illustrations and quizzes to help you grasp the concepts of each function and understand them in a practical way. Excel files and screenshots are provided to make the understanding of the lectures very easy.
Depending on the prior preparation, this course can be completed in one month or less.
Taking this course will provide you with a rich array of advanced analytical tools that can be used for educational and professional work.
After completing this course, you will feel comfortable using EXCEL 2010-2013 advanced statistical functions for Analytics and Applied Statistical analyses.
In this course, you will learn advanced statistical functions about the Normal or Bell-Shaped distribution, Student t distribution, chi square, lognormal, negative binomial, etc..
You will effectively be able to solve inferential statistical problems using the functions you studied and feel comfortable using the power of EXCEL advanced statistical function for analyses.


Bill C. O.
so far so good
Very detailed with every bit i always assumed