Brief Summary
This course dives into Technical Analysis, focusing on crowd psychology and key indicators. You’ll learn how to make informed trading decisions while discovering the strengths and limits of this approach through real case studies. It's all about mastering your trade entry!
Key Points
-
Understanding Technical Analysis and crowd psychology.
-
Different types of indicators: Price, Momentum, Volume, etc.
-
Importance of a few reliable indicators over many.
-
Limitations of technical analysis: when it works and when it doesn't.
-
Case studies on real stocks and chart patterns.
Learning Outcomes
-
Grasp the basics of Technical Analysis and its psychological roots.
-
Identify and use key indicators for successful trading.
-
Analyze real market scenarios using case studies.
-
Understand the limitations of technical analysis.
-
Develop a personalized set of indicators for trading.
About This Course
Technical Analysis is a vital tool to assist in proper trade entry. A great entry increases your chances of success.
MASTER TECHNICAL ANALYSIS
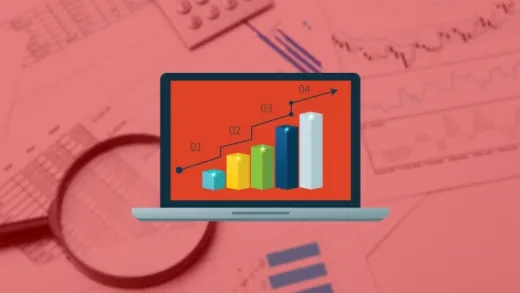
Technical analysis has become extensive in recent years. We study the psychology of technical analysis and why they work 60 to 70% of the time. There are several categories of technical analysis - Price indicators, Support and Resistance levels, Momentum indicators, Volume indicators, Oscillators and Statistical price movement indicators. This is again an area where the KISS rule applies - Keep It Simple S-----. We cut through all the noise and show you why there are 4 or 5 indicators you should study and that's all you really need to make informed entry and exit decisions. Technical analysis is a self-fulfilling prophecy and gives deep insight into crowd behavior.
What you will master
What is Technical Analysis and why is crowd psychology an important factor in markets
Why does technical analysis work only 60 to 70% of the time
Why are Price indicators called "lagging" indicators
What are potential "leading" indicators
A study of Moving averages and which ones are helpful
What are the best indicators for short, medium and long term trends
Why do we need a "confluence" of indicators to make a decision
Why the Bollinger Bands are a cool indicator
Adjusting technical indicators to match your trading timeframe
Why technical analysis "works until it doesn't"
SECTION 1
Lecture I - What is Technical Analysis
Technical analysis is primarily a study of Crowd psychology and crowd behavior. If a certain number of people act in unison at a certain time, and other people can observe this group of people taking a certain action, then they are motivated to join in. And it becomes a self-fulfilling prophecy. Technical analysis is a very powerful force in the markets, but it has limitations. This Introductory lecture explains these details.
Lecture 2 - Crowd psychology and Crowd behavior
What is crowd psychology and why does it matter ? In this lecture, we study the S&P 500 Index over the last 20 years, and also observe a certain technical pattern that is currently playing out textbook-style. How could this pattern impact the markets this year ?
Lecture 3 - Limitations of Technical Analysis
What are the limitations of Technical analysis - when does it work, and when does it not work. Knowing when it does not work is as important as knowing when it works.
SECTION 2
Section 2 is a detailed discussion of all the types of Technical analysis indicators. You have various kinds - Price Indicators, Momentum indicators, Statistical and Volatility indicators, Support and Resistance, Volume indicators and Oscillators. Each of these indicator types are broken down in detail as well as insightful tips on their usage and interpretation.
SECTION 3
Section 3 is a complete case study set of 5 stocks -
1) Apple (AAPL) - 1 Year Chart. And how AAPL gave 3 points of entry for the perfect Bearish trade.
2) Priceline (PCLN) - No clear long-term signals, but a short term bearish trade could be played out.
3) Chipotle Mexican Grill (CMG) - an absolutely amazing Statistical indicator gives away the perfect "Long" signal
4) The Gold ETF GLD - Hidden inside a very bearish chart is the potential for a reversal trade
5) And on the Google (GOOG) charts, we can study the battle between the Bulls and Bears at a recent breach of Google's all-time high.
Applying correct Technical Analysis techniques can set you with a fantastic trade entry. If you get your trade entry correctly, you have just increased your chances of a profitable trade a whole lot.
Master Technical analysis and learn to time your trade entry as accurately as possible
Create a reliable set of indicators to guide you with trade entry
Learn all about Price indicators, Momentum indicators, Oscillators, Support and Resistance, Volatility indicators and Volume indicators


Brij B. P.
No actionable information and lot left for ur own browsing