About This Course
Create Attractive Advanced Excel Dashboard for Data Analytics with Visual using Excel Tools, Functions and Excel Macros
Microsoft Excel Dashboard help user visualizes complex scenarios and problem better. Manager with the help of Advanced Excel dashboard can make better business decisions.
Our course is meant for professional working at different levels of careers, i.e., From MIS executive to Data Analyst.
MS Excel made it easy to make Dashboards for any Analytics. Business user can easily analyze data to create powerful reports and dashboards in a fraction of the time of traditional spreadsheets.
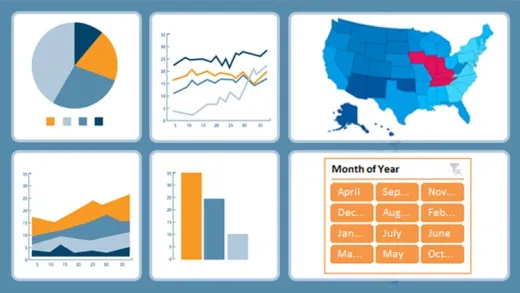
In this course, you'll learn to make dashboard in Excel in different ways:
Dashboard using Pivot Table like Multiple Pivot, Interlinked Pivot, Slicer buttons to control charts, Advanced Charts, etc.
Create Chart for comparison from the Pivot table
Create Trend line from the Pivot table
Creating Pie Chart from Slab Report from Pivot table
Inserting Slicer using Chart & Customize Slicer Setting
more..
Dashboard using Excel Functions:
Importing Data from the Internet
Converting Line Item into a Currency Table
Calculation of Currency using INDEX and MATCH
AverageIF for calculating Country Wise Salary
Dynamic Dropdown
List longitude and latitude with plotting data on dashboard
Using REPT Function based on the percentage calculation
Advanced INDEX and MATCH with multiple references
Insert World Map into the chart
Plotting Data on Map Chart and Controlling Map Preview from drop-down
Preparing the base by removing duplicate for Dashboard
more..
Dashboard using Excel Macros & Functions
Implementation of OFFSET for dynamic data
Using macro to update pivot table based on the Job Type
Preparing data for Spiderweb chart and change the graph setting
Use of Array functions like MAXIF and MINIF with single and multiple parameters
Creating Name Range using shortcut
more..
This course is for all business users who want to learn how to create management reports, analyze data and create interactive dashboards using Excel 2010 and later versions.
Important information before you join:
Once enrolled, you have unlimited, lifetime access to the course!
You will have instant and free access to any updates I'll add to the course.
I will give you my full support regarding any issues or suggestions related to the course.
Access to all videos 24 x 7 - learn online from anywhere
A 30-day money back guarantee (we want you to be 100% satisfied)
--------------------------------------------------------------------------------------------------------------------------------
If you have read this far, next action is JOINING this course. Invest 4 hrs. for the benefit of lifetime Ninja status on Advanced Excel Dashboard Course.
Analyze data and create reports in a fraction of the time of spreadsheets
Create new powerful calculations, KPIs and Key Metrics
Plot data on Map in Advanced Excel Dashboard


Ancy D.
Too Fast on 2nd Dashboard