Brief Summary
This course makes stats easy peasy! You’ll learn to analyze data, understand different measurement scales, track averages, and see how data spreads out. Plus, you’ll get a taste of probability and some cool graphs along the way. Perfect for anyone looking to get comfy with numbers!
Key Points
-
Scales of measurement: nominal, ordinal, interval, ratio
-
Central tendency: mean, median, mode, and weighted mean
-
Variability: standard deviation, variance, and percentiles
-
Charts and graphs: cumulative frequency distribution and stem-and-leaf plots
-
Introduction to probability, normal distribution, and z-scores
Learning Outcomes
-
Understand and identify different scales of measurement
-
Calculate and interpret measures of central tendency
-
Explain variability and interpret data rankings
-
Organize and summarize data using charts and graphs
-
Gain foundational knowledge in probability and z-scores
About This Course
Introductory Statistics as Covered in the Social, Behavioral, and Natural Sciences
November, 2019
In the course, you will learn how to easily and effectively analyze and interpret data involving introductory statistics. The following topics are covered in this course:
Scales of measurement - nominal, ordinal, interval, ratio.
Central Tendency - mean, median, and mode are illustrated along with practice problems; measures of central tendency and skewed distributions are explained, as well as how to calculate the weighted mean.
Goals/Learning Objectives: Summarize a set of data, find the center location in a distribution of scores, understand and identify the location of measures of central tendency in skewed distributions, understand and interpret how to find the overall or combined mean for two different sets of data.
Variability - How to calculate the standard deviation and variance as well as how to interpret percentiles are provided in simple and clear language.
Goals/Learning Objectives: Understand and explain variability (spread) in a set of numbers, including how to rank data and interpret data such as standardized test scores (for example, the 95th percentile).
Charts and Graphs - How to calculate a cumulative frequency distribution table as well as how to calculate a stem and leaf plot is illustrated.
Goals/Learning Objectives: Learn how to easily organize, summarize, understand, and explain a set of numbers.
Probability, the Normal Curve and z-Scores - An introduction to probability is provided, along with properties of the normal distribution and how to calculate and interpret z-scores
Bonus Features: Cement understanding with practice opportunities including several quizzes with complete video coverage of the solutions.
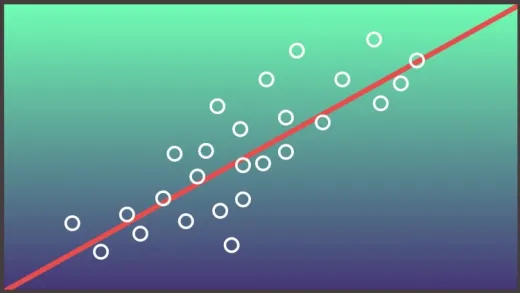
Update: New Videos Added on Hypothesis Testing and on Correlation! (See Sections 6 and 7 of the Course.)
Understand and learn how to calculate a number of different descriptive statistics
Increase your quantitative and numerical reasoning skills!
Increase marketable job skills in data analytics


Dhaarna
It was good, got the basis understanding of statistics. But more information on how to do it using excel and large data set and how to infer them would be helpful. Along with that different test like chi-square, anova, t-test, f-test and result analysis would be helpful.